What is a good TikTok engagement rate?
We measured 1.37 million TikTok videos. Median engagement is 7.5% by views, but it runs from 5.9% to 9.7% depending on how far the video travelled.
Ask ten marketers what counts as a good TikTok engagement rate and you will get ten answers, most of them borrowed from Instagram or based on follower counts. So we measured it directly — first across 129,000 videos, and since then across 1.37 million.
The bigger measurement changed the answer. There is no single good engagement rate, because the number depends heavily on something almost nobody states: how far the video travelled. A typical 5,000-view video and a typical 5-million-view video are not held to the same standard, and judging one by the other’s benchmark will mislead you in both directions.
The short answer
Across 1.37 million videos, the median engagement rate — likes, comments, and shares divided by views — is 7.5% by views. But that single figure hides a range from 5.9% to 9.7%, depending on how far a video travelled.
An earlier, separate measurement of about 129,000 videos gives the spread by quartile:
| Where a post lands | Engagement rate (by views) |
|---|---|
| Bottom quartile | 3.3% |
| Median (typical) | 6.5% |
| Top quartile | 11.8% |
| Top 10% | 18.2% |
As a rough rule of thumb for that sample: under about 3.3% puts a video in the bottom quarter, around 6-7% is typical, and clearing 12% puts it in the top quarter. Break 18% and you are in the top tenth. Read the next section before applying any of that to a video whose reach was very different.
Engagement by views, not followers
This is the part that matters most, so read it before comparing our number to anything else.
Most published TikTok benchmarks divide engagement by follower count, which is why you often see figures in the 2-5% range. We divide by views instead. On TikTok, the For You feed pushes videos to people who do not follow you, so views routinely dwarf followers, and a per-view rate better reflects how the audience that actually saw a video responded to it.
The two numbers are not comparable. A 7.5% engagement rate by views is not “higher” than a 3% rate by followers — they measure different things. If you benchmark your own posts against these figures, make sure you are dividing by views too.
It depends on how far the video travelled
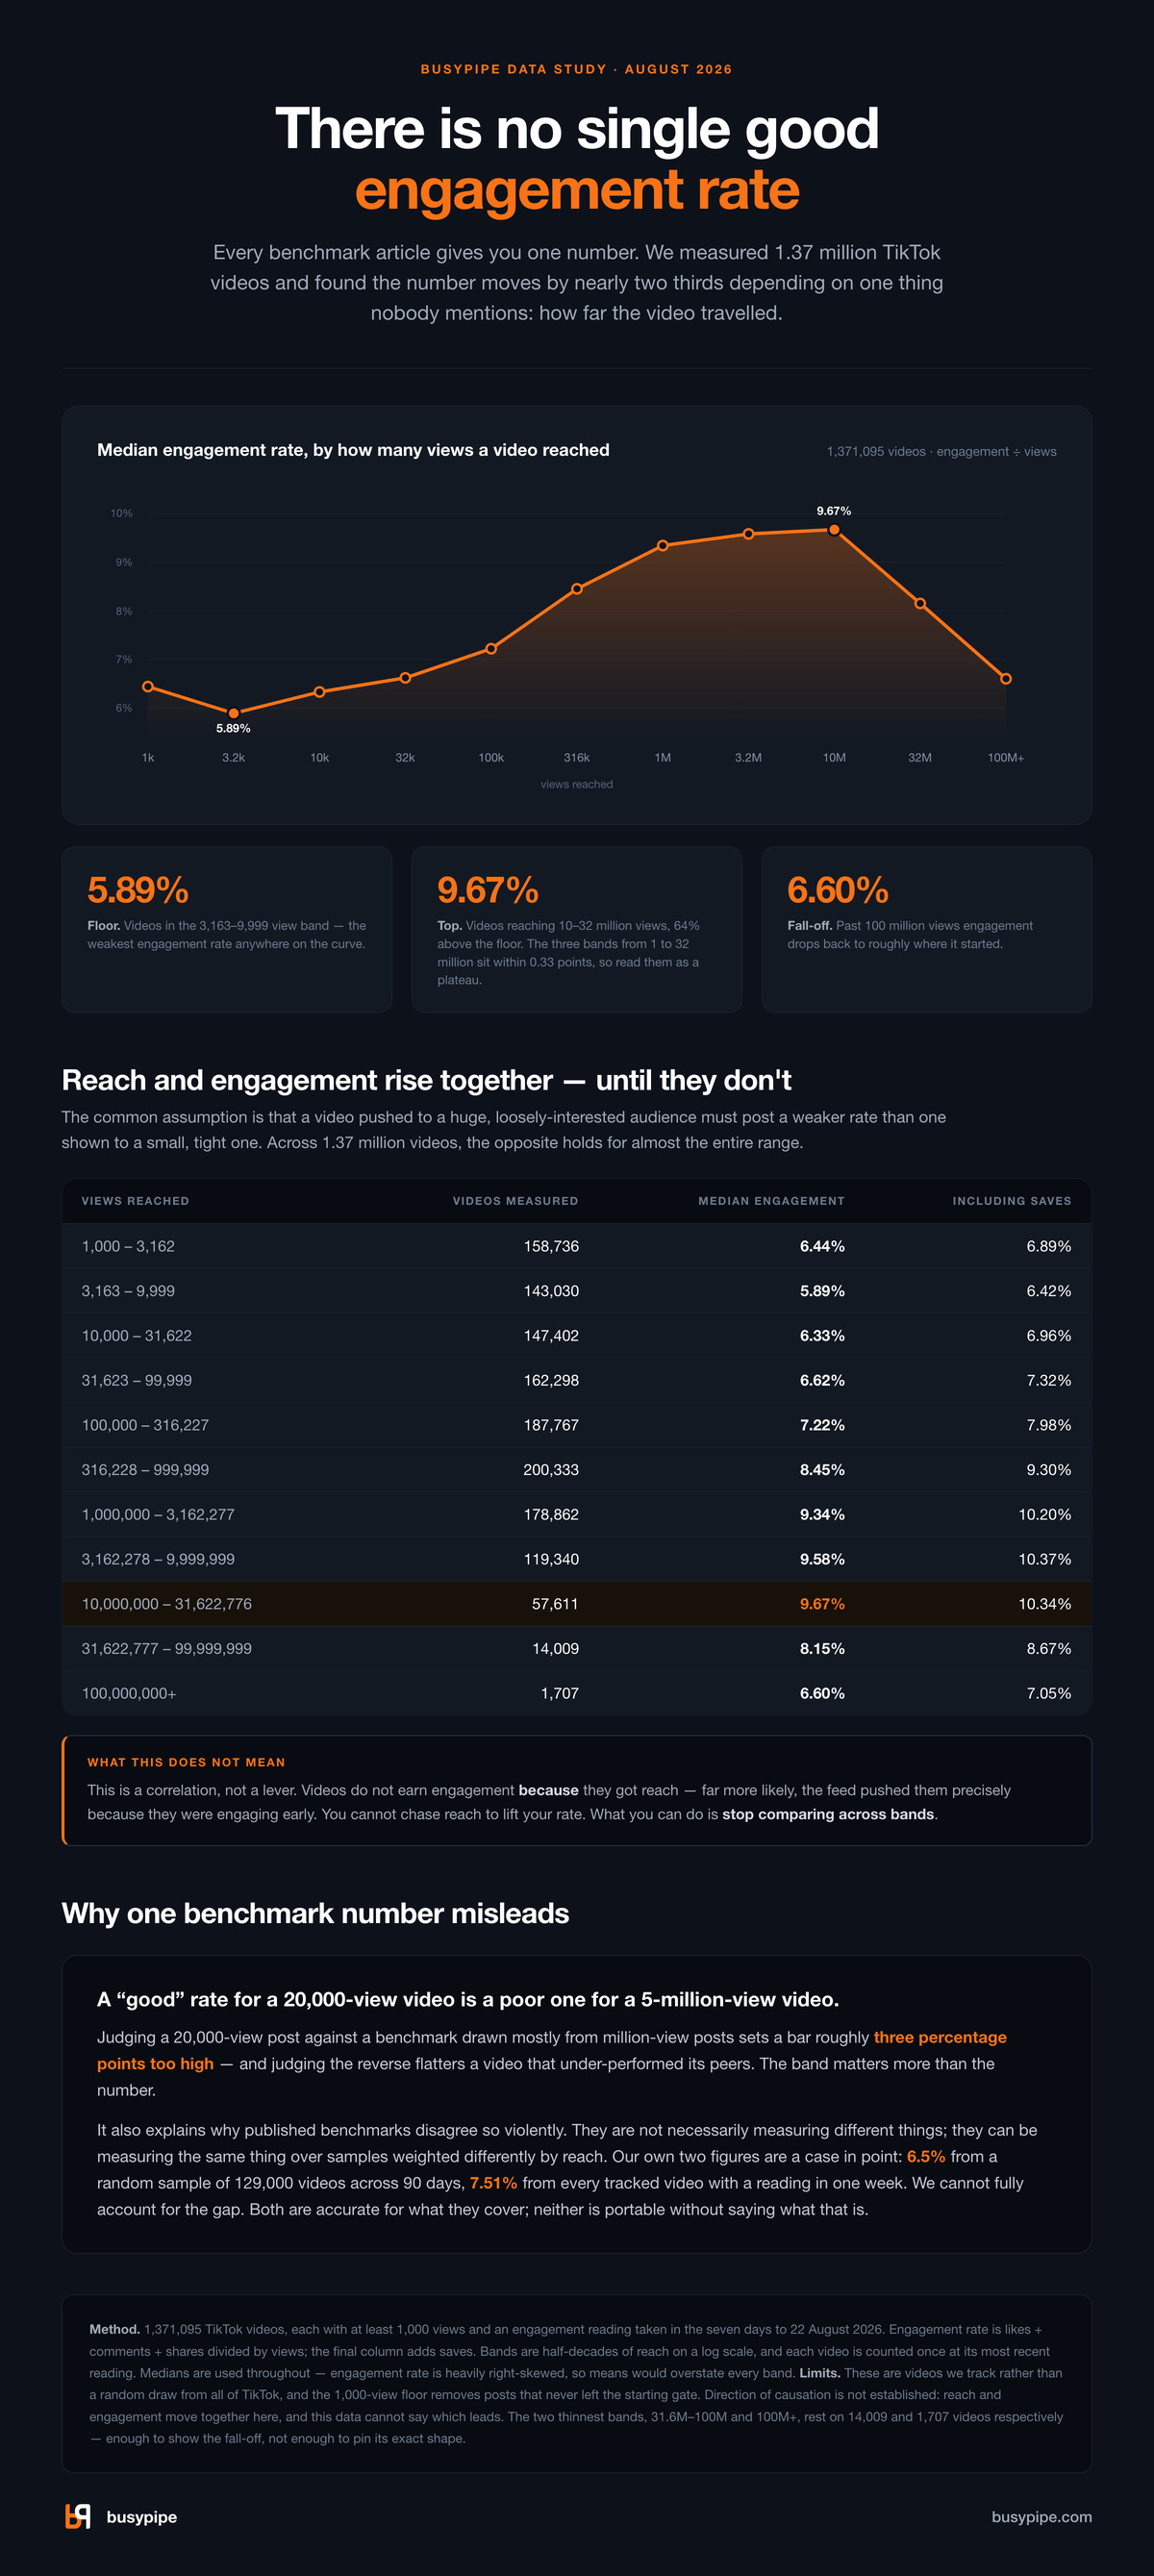
This is the finding that changed how we read our own benchmark. Grouping 1.37 million videos by the reach they achieved produces a clear curve, and it runs opposite to the common assumption.
| Views reached | Videos measured | Median engagement | Including saves |
|---|---|---|---|
| 1,000 – 3,162 | 158,736 | 6.44% | 6.89% |
| 3,163 – 9,999 | 143,030 | 5.89% | 6.42% |
| 10,000 – 31,622 | 147,402 | 6.33% | 6.96% |
| 31,623 – 99,999 | 162,298 | 6.62% | 7.32% |
| 100,000 – 316,227 | 187,767 | 7.22% | 7.98% |
| 316,228 – 999,999 | 200,333 | 8.45% | 9.30% |
| 1,000,000 – 3,162,277 | 178,862 | 9.34% | 10.20% |
| 3,162,278 – 9,999,999 | 119,340 | 9.58% | 10.37% |
| 10,000,000 – 31,622,776 | 57,611 | 9.67% | 10.34% |
| 31,622,777 – 99,999,999 | 14,009 | 8.15% | 8.67% |
| 100,000,000+ | 1,707 | 6.60% | 7.05% |
Engagement rate rises with reach across most of the range — from 5.89% in the 3,163-to-9,999 view band up to 9.67% for videos reaching 10 to 32 million. The top three bands sit within 0.33 points of each other, so treat 1-to-32 million as one plateau rather than reading the ordering inside it too closely. Past roughly 30 million it falls away, back to 6.60% for the rare videos clearing 100 million views. It also dips at the very bottom: the 1,000-to-3,162 band runs at 6.44%, above the band just after it.
We had previously written that a video shown to millions of loosely-interested viewers tends to post a lower rate than one shown to a smaller, tighter audience. At this sample size that turns out to be wrong for most of the distribution, and it is only true at the extreme top end.
What this does not mean. This is a correlation, not a lever. Videos almost certainly do not earn engagement because they got reach — far more likely, the feed pushed them precisely because they engaged people early. You cannot chase reach to lift your rate. What you can do is stop comparing across bands.
It also explains why published benchmarks disagree so violently, including with each other. They are not necessarily measuring different things; they can be measuring the same thing over samples weighted differently by reach, and as the table shows, that alone moves the answer by more than three percentage points.
Our own two figures are a case in point. The 6.5% above came from a random sample of 129,000 videos drawn across a 90-day window; the 7.5% here comes from every tracked video with a reading in a single week. We cannot fully account for the gap between them — the samples are built differently, and which videos happen to land in a sample is exactly what this post shows the median to be sensitive to. Both are accurate for what they cover. Neither is portable without saying what that is.
Reading the spread
The gap between the quartiles is the other useful part. Half of the videos in our original sample fall between 3.3% and 11.8% engagement. That is a wide band, and it is normal — engagement rate depends on format, topic, and audience as well as reach.
That is why a single benchmark is a starting point, not a verdict. What tells you more is where a post sits relative to your own catalog and your competitors at comparable reach, and whether that is trending up or down over time.
Saves are worth watching
Add saves to the mix — likes, comments, shares, and saves divided by views — and the median rises to 7.1% in the original sample, and to 8.2% across the full 1.37 million. Saves are a quieter signal than likes, but often a stronger one: a save means someone wanted to come back to a video, which is exactly the kind of intent that predicts durable interest. If a post has an ordinary like rate but an unusually high save rate, that is worth paying attention to.
Saves add between four and nine tenths of a percentage point at every reach band, as the last column of the table above shows. They also flatten the top of the curve: counting saves, the 3.2-to-10 million and 10-to-32 million bands are effectively tied at 10.37% and 10.34%, a gap too small to call a peak either way.
How to use these benchmarks
Numbers like these are most useful as a reference line, not a target.
- Compare like with like on reach. This is the one that trips people up. Judging a 20,000-view post against a benchmark drawn from million-view posts sets the bar around three percentage points too high, and judging the reverse quietly flatters a video that under-performed its peers.
- Benchmark against your own median, not just the global one. Your niche may run higher or lower. Track your typical rate, then judge each post against it.
- Compare with competitors. A 6% rate means more or less depending on what similar accounts are doing. Benchmarking against a set of competitors turns a raw number into a decision.
- Watch the trend. A rate drifting down over weeks is a signal worth catching early, well before it shows up in follower growth.
This is the kind of comparison busypipe is built for — track your posts and your competitors side by side, and see how engagement moves over time rather than guessing from a single snapshot. If you are also chasing reach, our guide on how to find trending sounds on TikTok covers the other half of the equation.
Methodology
Being clear about the sample is the whole point, so here is exactly what this is and is not.
- What we measured. Engagement rate for each video at our latest observation, defined as (likes + comments + shares) divided by views, with a second version that adds saves.
- The reach-band sample. 1,371,095 videos, each with at least 1,000 views and an engagement reading taken in the seven days to 22 August 2026. Each video is counted once, at its most recent reading. Bands are half-decades of reach on a log scale.
- The quartile sample. The 3.3% / 6.5% / 11.8% / 18.2% figures come from our earlier measurement: a random sample of about 129,000 videos, each with at least 1,000 views, drawn from the roughly 47 million posts we tracked over a 90-day window, excluding ads and sponsored posts.
- What is not behind the gap. The 129,000-video measurement excluded ads and sponsored posts and the reach-band measurement does not, but that cannot account for any of the difference: ads and sponsored posts are 0.002% of the videos we track, six in every four hundred thousand.
- Why we report medians. Engagement rate is heavily right-skewed. Means would overstate every band.
- Where the posts come from. Our sample spans more than a hundred countries and is globally distributed, with the United States the largest single market at roughly a quarter of posts, followed by the United Kingdom, Germany, Indonesia, and Brazil.
- The honest caveats. These are posts busypipe tracks, surfaced through trend and creator discovery, so the sample skews toward content that already reached some visibility — not a random cross-section of every video posted, most of which get very few views. The 1,000-view floor removes posts that never left the starting gate. Because we observe posts at varying ages, these are mature cumulative rates, not first-day numbers. Direction of causation is not established: reach and engagement move together here, and this data cannot say which leads. The two thinnest bands, 31.6M–100M and 100M+, rest on 14,009 and 1,707 videos — enough to show the fall-off, not enough to pin its exact shape. And, again, the denominator is views, not followers.
In short: there is no single good TikTok engagement rate. Across 1.37 million videos the median is 7.5% by views, but it runs from about 5.9% at the floor, in the 3,163-to-9,999 band, to about 9.7% for those reaching tens of millions. Find the band your video actually landed in, then measure what matters — how your posts move against your own baseline and your competitors, over time.
Want to see where your videos land? Start for free with busypipe.
Spot rising sounds before they peak
busypipe tracks trending sounds, creators, and hashtags on TikTok. Every account starts with a 14-day Professional trial — no card required.
Start for free