We watched a TikTok hashtag fill up
A film release pushed one hashtag from 291,000 posts to 2 million in twelve weeks. We tracked it the whole way, and reach per post fell 47% while the posts kept arriving.
Most advice about trending hashtags is written from the outside: find one early, ride it, get out before it saturates. It is sensible-sounding and almost never accompanied by a measurement, because measuring it means watching a single hashtag closely for weeks before anyone knows it is going to matter.
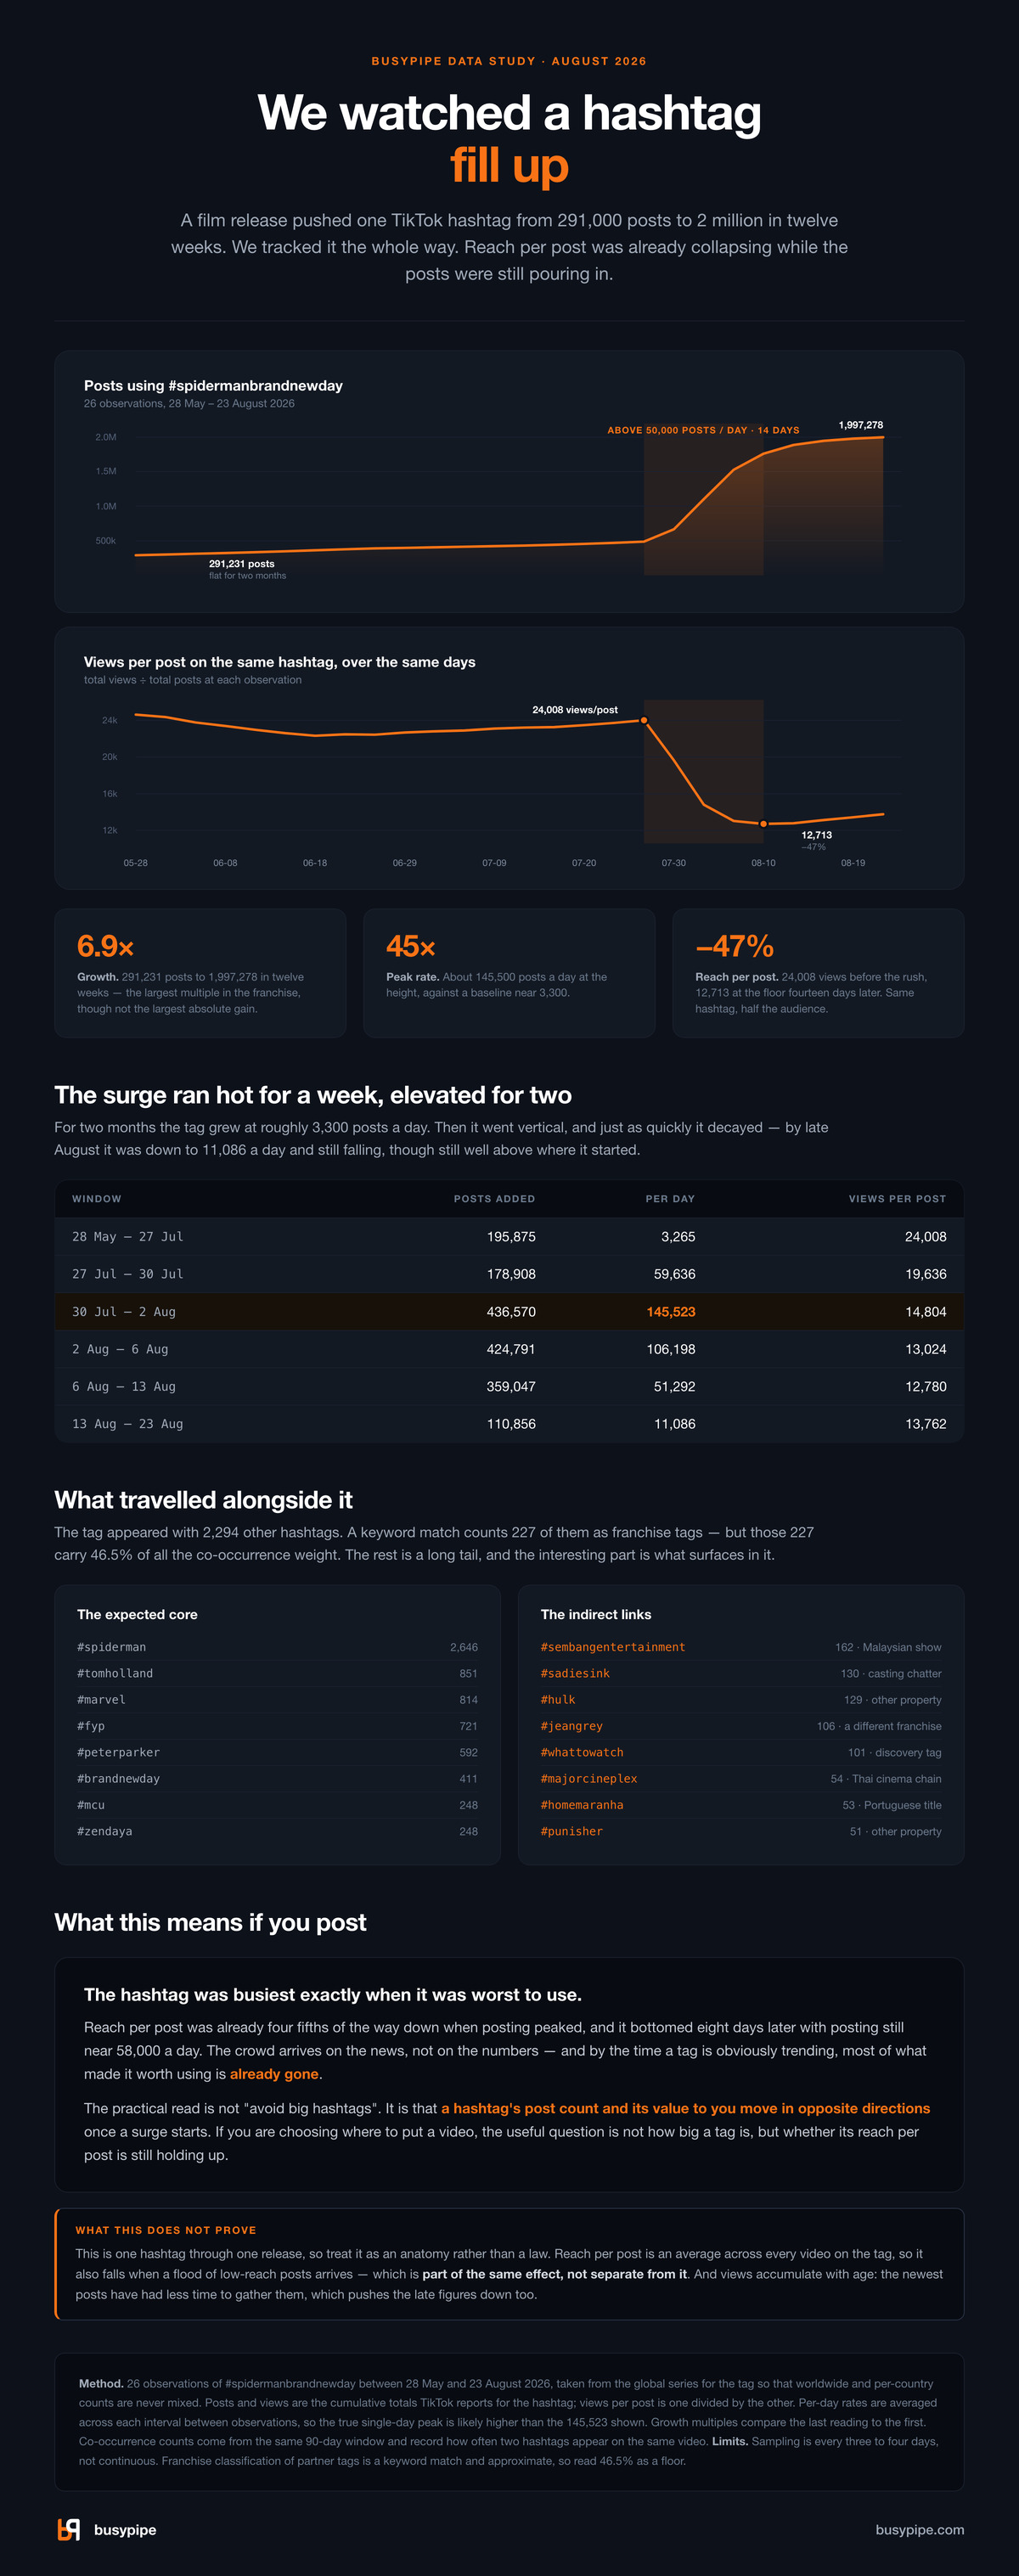
We happened to be doing exactly that. Between 28 May and 23 August 2026 we took 26 readings of #spidermanbrandnewday, the tag attached to the year’s Spider-Man release. It went from 291,231 posts to 1,997,278 — just under seven times bigger — and the shape of that climb turns out to be more useful than the size.
The surge ran hot for a week, elevated for two
For two months the tag grew at roughly 3,300 posts a day — steady, unremarkable, the pace of a franchise tag with a film somewhere on the horizon. Then it went vertical.
| Window | Posts added | Per day | Views per post |
|---|---|---|---|
| 28 May – 27 Jul | 195,875 | 3,265 | 24,008 |
| 27 Jul – 30 Jul | 178,908 | 59,636 | 19,636 |
| 30 Jul – 2 Aug | 436,570 | 145,523 | 14,804 |
| 2 Aug – 6 Aug | 424,791 | 106,198 | 13,024 |
| 6 Aug – 13 Aug | 359,047 | 51,292 | 12,780 |
| 13 Aug – 23 Aug | 110,856 | 11,086 | 13,762 |
At its height the tag was taking roughly 145,500 posts a day, about 45 times its resting rate. How long that lasted depends where you draw the line, so here are two: it ran above 100,000 posts a day for 7 days (30 July to 6 August), and above 50,000 for 14 (27 July to 10 August — the 6-to-10 August stretch averaged 58,354 a day, the 10-to-13 August stretch 41,876, so the line is crossed inside the table’s 6-to-13 August row). Three weeks after the peak it was back to 11,000 a day and still falling.
Both figures come with a caveat worth stating: we sampled every three to four days, not continuously, so the edges of that window are soft by a couple of days either way. Every guide will tell you the window is short. This is one case where the shortness has a number attached and a stated threshold behind it.
Reach per post fell 47% while it was happening
This is the part we did not expect to see so cleanly. The second chart above is the same hashtag over the same days, showing total views divided by total posts.
Through the quiet period that figure sat between 22,321 and 24,614 — remarkably stable for two months. Then, as the surge arrived, it fell off a cliff: 24,008 on 27 July, 14,804 by 2 August, bottoming at 12,713 on 10 August. A slight recovery followed, to 13,762 by 23 August.
The hashtag’s total views were growing the whole time. The post count was simply growing faster, so each post got a thinner slice. Put plainly: a post entering the tag at the floor got about half the reach one entering two weeks earlier did — 12,713 views per post against 24,008. At the busiest moment itself the figure was 14,804, about two thirds of where it had sat all summer.
The two curves move together, and the floor arrives late. By the time posting peaked on 2 August, about four fifths of the decline in reach per post had already happened — and the floor itself came eight days later, on 10 August, with posting still running near 58,000 a day. So the crowd was not arriving after the payout stopped, exactly; it was arriving while the payout was falling, and it kept arriving as it bottomed out. Either way, the busiest stretch of the tag was not its most rewarding one.
The release lifted more than its own tag
One thing worth saying because it cuts against the obvious reading: the evergreen #spiderman grew too, and by a large absolute amount — 3.8 million posts over the window against the release tag’s 1.7 million. Part of that is simply its size; a tag with eighteen million posts adds a lot without needing a large multiple. Netting out what its own baseline rate would have produced anyway, the release-attributable excess is roughly 2.0 million for #spiderman against 1.4 million for #spidermanbrandnewday.
We are not going to push that comparison further. We have dense daily readings for three tags out of the eighteen in the family, which is enough to say the parent tag moved and not enough to rank what moved most or to say which tags surged together. The saturation finding above rests on 26 readings of a single tag; the franchise comparison would need the same depth across all of them.
What travelled alongside it
The tag appeared on videos with 2,294 other hashtags over the window. A keyword match counts 227 of those as franchise tags, and those 227 carry 46.5% of all the co-occurrence weight. The match is crude — it classes #brandnewday, the film’s own subtitle and the sixth-largest partner, as outside the franchise — so read 46.5% as a floor. The network is a dense core wrapped in a very long, very thin tail; the median partner tag appears alongside it exactly once.
The core is predictable: #spiderman (2,646 co-occurrences), #tomholland (851), #marvel (814), #peterparker (592), #mcu and #zendaya (248 each). Generic reach tags like #fyp (721) sit in there too, as they do everywhere.
The tail is more interesting, because it shows what a film tag actually touches:
#sadiesink(130) and#jeangrey(106) — casting speculation pulling a different franchise’s character into a Spider-Man tag.#hulk(129),#punisher(51) — adjacent properties riding the attention.#majorcineplex(54) — a Thai cinema chain, marketing showtimes.#homemaranha(53) — the Brazilian Portuguese title, a whole language community attached to the English tag.#sembangentertainment(162) — a Malaysian entertainment show covering the release.
None of these would appear in a keyword tool. They are the visible edge of who is actually talking about a thing, and they are the reason co-occurrence is worth looking at: it maps the neighbourhood, not just the address.
What to take from this
The instinct behind “get in early” is correct. What this case adds is a sense of scale, and a warning about the signal people actually follow.
- A hashtag’s post count and its usefulness move in opposite directions once a surge starts. Size is not the question. Whether reach per post is still holding up is the question.
- Obvious means late. By the time a tag is visibly trending, the conditions that made it worth using have already changed. Here, reach per post hit its floor on 10 August with posting still at about 40% of its peak rate — long past the point where the tag was worth joining.
- A release lifts the big evergreen tag too. It is not a choice between a hot tag and a dead one. What the release tag offers that the parent does not is the multiple — a far larger share of its audience arriving because of this moment.
Methodology
- What we measured. 26 observations of
#spidermanbrandnewdaybetween 28 May and 23 August 2026, taken from the global series for the tag so that worldwide and per-country counts are never mixed. Posts and views are the cumulative totals TikTok reports for a hashtag; views per post is one divided by the other. - Rates. Per-day figures are averaged across each interval between observations. Sampling is every three to four days rather than continuous, so the true single-day peak is likely higher than the 145,523 shown.
- Tags are not mutually exclusive. A video carrying both
#spidermanand#spidermanbrandnewdaycounts once in each tag’s total, so per-tag figures are not counts of distinct videos and “added posts” means activity on a tag. - Co-occurrence. How often two hashtags appear on the same video, over the same 90-day window. Franchise classification of partner tags is keyword-based and approximate.
- The honest caveats. This is one hashtag through one release — an anatomy, not a law. Reach per post is an average across every video carrying the tag, so it falls when a flood of low-reach posts arrives; that is part of the same saturation effect rather than separate from it, but it does mean the figure is not a claim about any individual video. Views also accumulate with age, and the newest posts have had less time to gather them, which pushes the late figures down as well. The comparison covers the Spider-Man tags with at least five observations in the window; we track more than that, and TikTok carries many more again.
If you want to watch this happen in advance rather than read about it afterwards, that is what busypipe does — track hashtags, sounds, and competitors over time, and see the reach-per-post curve while it still matters. Our companion piece on what a good engagement rate actually is covers the other side of the same question.
Start for free and track your first hashtags.
Spot rising sounds before they peak
busypipe tracks trending sounds, creators, and hashtags on TikTok. Every account starts with a 14-day Professional trial — no card required.
Start for free